EDGE COMPUTING-BASED AI DASHBOARD FOR WEATHER PREDICTION IN SMART CITY APPLICATION(ALIBABA CLOUD PRODUCTS)
INTRODUCTION
Weather prediction, in general, is a complex process and challenging task. It requires various parameters to forecast the weather. Monitoring and predicting weather help in various fields like agriculture, travel, pollution dispersal, communication, disaster management, etc. Henceforth, weather forecasting plays a vital role in every day-to-day aspect, utilizing the needs of a common man to research scientists. This explains why forecasting cannot be predicted with simpler means. In the present times, there are high-definition satellite images to accurately predict the forecast of the upcoming days, but the process is neither simple nor economical. An accuracy of more than 90% is obtained, based on the dataset. Recent studies have reflected that machine learning techniques achieved better performance than traditional statistical methods. Deep learning, a branch of artificial intelligence, has been proved to be a robust method in predicting and analyzing a given data set. Here, this module helps us predict the weather using the data and analyze it with a good accuracy rate and proves to be a simple one. The module involves the use of concepts related to artificial intelligence under Deep Learning and also predicts the air quality data and water quality data generated from the devices with speed computation. The results obtained show that it can estimate the weather conditions more precisely and accurately. Smart City brings both government and citizens closer for better engagement. The Control center of a smart city is a Single platform to view overall city condition, also able to track the location of support forces and deploy in real time, Alerts are received immediately with instantaneous, Emergencies sent to citizens via citizen app .some of the examples of smart cities Amsterdam Smart City aims at transforming the city into the most sustainable city by 2040 with enhanced city operations and quality of life
THE MAIN VALUE OF THE PROJECT:
IoT has to manage very high volumes of data. If they share the same central server, all of them can slow down the server. For weather, Air the data needs to be processed up from time to time, Bulk data creates complexities for not just the server, but all the fragments of the IoT system. If the server slows down or fails, all the connected devices also fail. In edge computing, data is accessible locally to connected devices. edge technology allows the data processing at each device ‘edge’. It is closer to the data source. The proximity of the processing and data centers eliminates the need for data to travel to the centralized server, making the processing faster. And, as this reduces the data movement requirements, the response time reduces at each fragment of the IoT, contributing to high efficiency. Another speed benefit of this system occurs because all the data is not processed together centrally. So, at each processing center, only a part of the data processing is done. Simultaneous multi-processing makes the system more productive. And, when the entire network is not exchanging data all the time, it saves a lot of unnecessary network cluttering, while maintaining data sharing between nodes only as and when required
INNOVATION OF THE PROJECT
In this project, we mainly focused on weather forecasting, air quality monitoring, and water quality monitoring with quick computation, minimize latency, and advanced technology, the monitoring station generates massive amounts of data that are analyzed in the edger nodes (edge computing), the data processed through deep learning algorithm technique, stored and processed in the cloud Usage of products such as Data, QuickBI and through API call it will be displayed in the dashboards, The flow chart shows the flow of execution implemented in our project
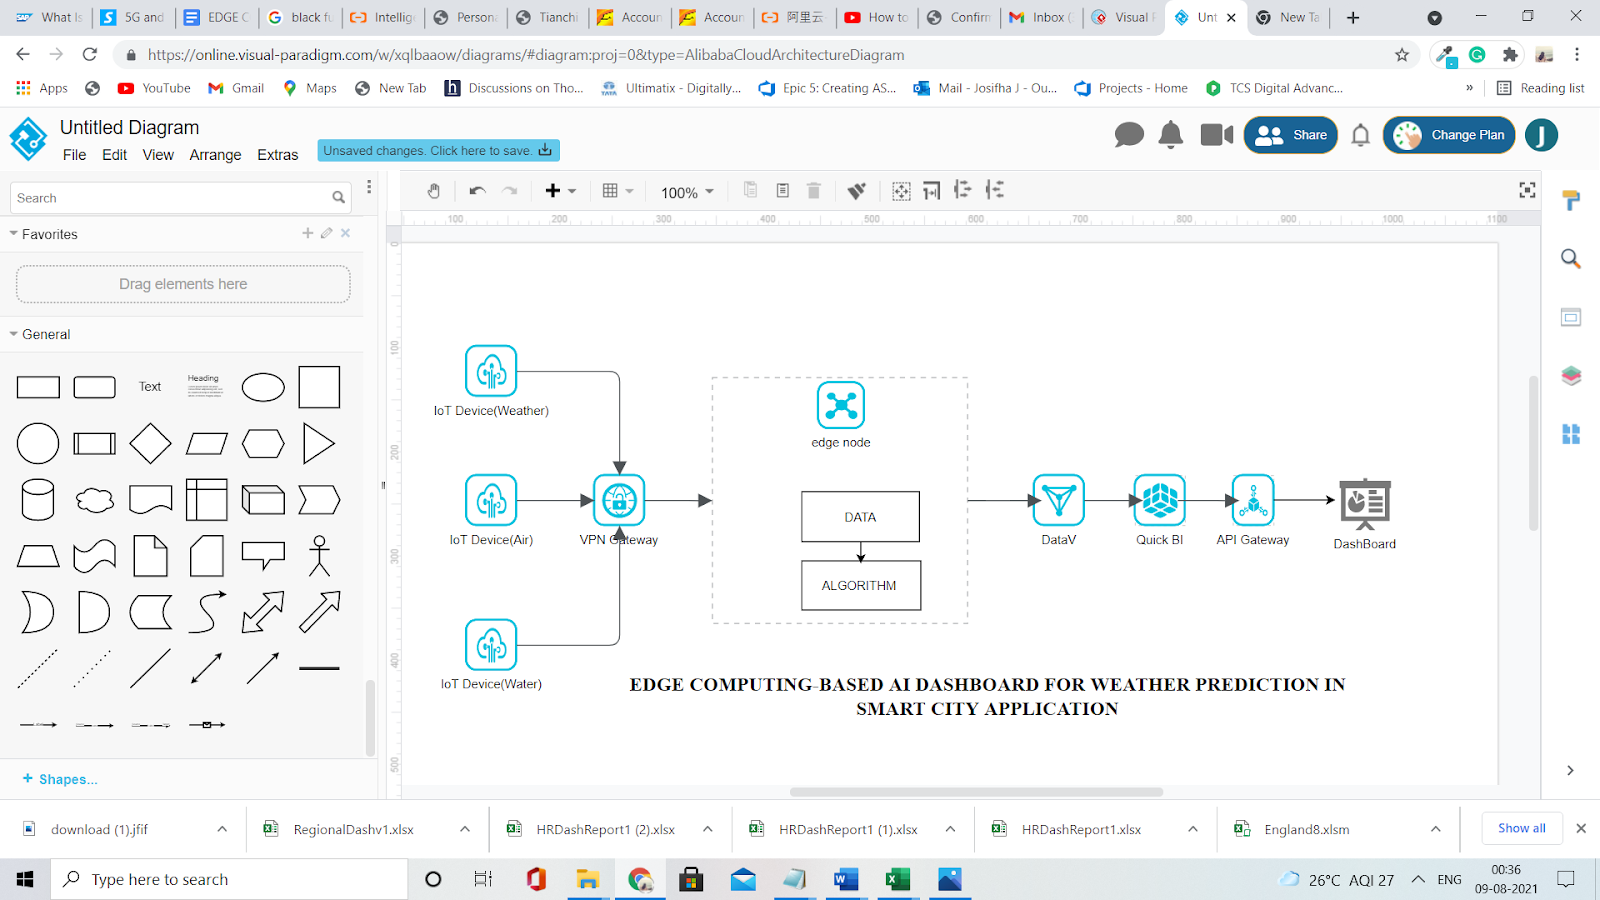
EDGE COMPUTING:
At the edge of the network, there are possibilities for positioning servers, processors, and data storage arrays as close as possible. so that you can reduce the distance, data traffic, the speed of electrons being essentially constant, you minimize latency. A network designed to be used at the edge leverages this minimal distance to expedite service and generate value.
INTERNET OF THINGS (IoT)
IoT means connected objects and devices that are equipped with sensors, software, and other technologies that allow them to transmit and receive data – to and from other things, Capture the data-Through sensors, IoT devices capture data from their environments. This could be as simple as the temperature or as complex as a real-time video feed. Share the data- Using available network connections, IoT devices make this data accessible through a public or private cloud, as directed Process, the data-At this point, the software is programmed to do something based on that data – such as turn on a fan or send a warning. Act on the data- Accumulated data from all devices within an IoT network is analyzed. This delivers powerful insights to inform confident actions and business decisions
WEATHER DATA
For weather forecasting need to know the values of seven physical quantities: temperature, pressure, density, humidity, and wind velocity, containing three components accounting for the three different wind directions from the station, Recurrent neural networks (RNNs) are a relatively more sophisticated class of neural networks especially suited for modeling complex relationships in time series data. RNNs can process multi-variate sequence data as inputs, perform temporal feature extraction, and generate multivariate output (predictions). From the RNN’s long short-term memory is used for our project, when the data is collected the LSTM networks weather data to identify the patterns and produce weather predictions we experiment with the state-of-the-art LSTM, which is a specialized form of RNN, and it is widely applied to handle data. The key concepts of the LSTM can learn long-term dependencies by incorporating memory units. These memory units allow the network to learn, forget previously hidden states, and update hidden states of the deep learning model consisting of stacked LSTM layers for weather forecasting using surface weather parameters. The model provides outputs, which are the predicted weather parameters.
AIR QUALITY
. The continuous online ambient air quality monitoring systems are equipped with analyzers for measurement O3, Particulate matter (PM10 and PM2.5), Carbon monoxide (CO), Nitrogen dioxide (NO2), Sulphur dioxide (SO2), Lead (Pb). Automatic Weather Station: Ultrasonic Wind Sensor, Barometric Pressure, Temperature, Relative Humidity, Rainfall, Solar Radiation, etc.
From the above station, the data are collected This collected data can be used as a testing dataset to forecast the Air Quality Index (AQI) using a deep learning algorithm for faster computation There are six AQI categories, namely Good, Satisfactory, Moderate, Poor, Very Poor, and Severe. Each of these categories is decided based on ambient concentration values of air pollutants and their likely health impacts, shown in the dashboard
WATER QUALITY (NORMAL WATER, SEAWATER, RAINWATER
The system as a whole comprises sensors, an analog to digital converter (ADC), a microcontroller, and a GSM module. The data collected can either be stored onboard via a cloud server.
A complete bundled set of sensors and included the sensors, microcontroller, and GSM communication. Furthermore, the deployment duration is expected to run for months or even years. To achieve this, the system design incorporates sleep mode i.e., the system gets a 15 minutes sleep time after an hour of continuous readings. To further extend battery life any idle modules have been set to off mode. The same is realized with the GSM and serial communication. Further to this, alerts have been set to notify the user of certain conditions such as battery life and progress reports. Graphs based on temperature, conductivity, PH normal water, & as well as seawater
DataV
DataV is an Alibaba Cloud data visualization service that allows you to analyze and present large and complex data sets as visual dashboards. DataV aims to bring the experience of data visualization to a wider audience and help less-experienced engineers build professional visual applications through an intuitive graphical interface. DataV can fulfill your data presentation requirements in scenarios such as conferences and exhibitions, business monitoring, risk warning, and geographic information analysis.
SMART CITY
Smart Cities contains various technology solutions ranging from Sensors, IoT, SCADA, Electronic camera, GIS, payments system, etc. which generates loads of structured data every second on different dimensions and also unstructured data emerging from different sources and third-party systems like social media, internet, websites, videos, image. Data collection is becoming easier and affordable in real-time due to advanced technologies. The life cycle data architecture of smart cities is followed. The First is Data Collection and Acquisition Layer acts as an interface between data sources and Intelligent Platform (Command and Control Platform, Analytics Platform) which encompass solutions to customize and prepare the data collected through various sources and formats i.e., structured and unstructured for analysis purpose. Next, the Structured and Unstructured Data is stored in Enterprise data Repository. Data warehousing is used by various users and decision making. Data Analysis Layer engine helps users derive information, intelligence, and knowledge from processed data stored in Enterprise Data repository for analysis. The service Delivery layer involves various applications and systems which could be used to deliver information, intelligence, and knowledge to the end-user.
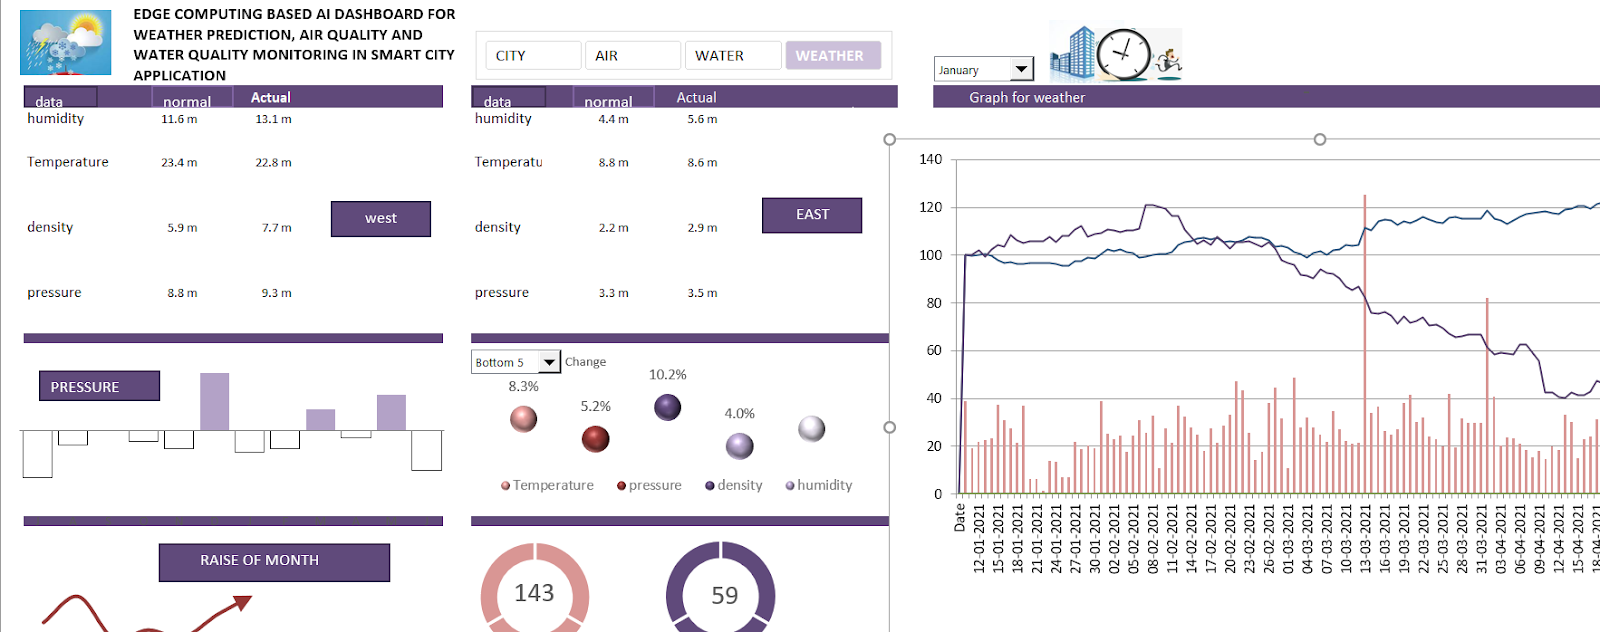
DASHBOARDS
The dashboard is a hybrid dashboard primarily concerned with assessing real-time data and administrative data from a variety of urban systems, its primary focus is a tool for citizen needs and to allow local government personnel to interact with urban data to understand city processes. It is very graphical and uses images as the main navigation control for accessing the content in which weather reports, air quality reports, water quality are displayed in a graphical nature
ADVANTAGES OF USING EDGE COMPUTING IN OUR PROJECT
Performance
Cost savings
Traffic
Decreased latency
Decrease in bandwidth use and associated cost
Decrease in server resources and associated cost
Added functionality
EDGE COMPUTING IOT AND 5G FUTURE
5G and edge computing in IoT have been inextricably linked since 2019. 5G increases speed by up to ten times that of 4G, while edge computing accelerates response time by bringing data processing closer to devices and users.5G will be able to serve all possible IoT and Smart City use cases, and provide the perfect connection depending on the individual demand for data rate, speed, and capacity.It can offer new features such as a high transmission speed of 20GB/sec, low latency of less than one millisecond means signal transmissions are possible almost in real-time
Ultra-low latency. Combined with 5G, edge computing significantly reduces latency, enabling the delivery of mission-critical services that require Ultra-Reliable, Low Latency Communication (URLLC)
Exponential bandwidth. 5G accelerates bandwidth, which means it can handle more connected devices that can respond in a matter of milliseconds
High performance. Using 5G, it is possible to communicate with the edge quickly, and edge applications can respond rapidly to the ever-growing demand of consumers
Data security. Edge computing brings cloud computing capabilities to remote locations and provides local processing and storage when security is essential
Minimized network traffic. Edge computing aggregates and processes IoT data at the edge of the network, reducing network traffic and transmission costs
Less power consumption. By removing computing requirements from the device and putting it at the edge, edge computing technology reduces energy consumption
FEW NON-TECHNICAL MEASURES FOR REDUCING CO2 EMISSION
Garbage dumping and burning creates a problem, hence, need to make a special clean-up drive in the month that takes away all construction and demolition waste and garbage collected in the city.
Electricity-based transportation system (buses, cars, motorbikes) needed along from metro trains.
Power plants emit sulphur dioxide and its contribution to particulate matter pollution is huge. It is almost 25-30 percent of PM. This means we have to deal with gaseous emissions as well.
All power plants in the country will have flue-gas desulfurisation technology to reduce air pollution.
COST ESTIMATION
TYPE – Software Application
PROJECT_SIZE – Large
TIME FRAME – 1 year maximum
COST – $120,000+
REFERENCE
[1]Boukabara. S., Krasnogorsk. V., Penny. S. G., et al, [2021], ‘Outlook for Exploiting Artificial Intelligence in the Earth and Environmental Sciences,’ Bulletin of the American Meteorological Society
[2] G. Salman, B. Kanigoro and Y. Heryadi, "Weather forecasting using deep learning techniques," 2015 International Conference on Advanced Computer Science and Information Systems (ICACSIS), 2015, pp. 281-285.
[3] Introduction to Data Mining and Knowledge Discovery,
Third Edition, Two Crowds Corporation,
[4] A. Gautam and P. Bedi, "MR-VSM: Map-Reduce based vector Space Model for user profiling-an empirical study on News data," 2015 International Conference on Advances in Computing, Communications and Informatics (ICACCI), Kochi, 2015, pp. 355-360.
[5] Chen, S.-M., and J.-R. Hwang. "Temperature prediction using fuzzy time series." Systems, Man, and Cybernetics, Part B: Cybernetics, IEEE Transactions on 30.2 (2000): 263-275.
[6] Maqsood, I., M. R. Khan, and A. Abraham. "An ensemble of neural networks for weather forecasting." Neural Computing & Applications 13.2 (2004): pp 112122
[7] H.F.Hawari, A.A.Zainal, M.R.Ahmad, “Development of real-time internet of things (IoT) based air quality monitoring system”, Indonesian J. of Electrical Eng. and C.S. vol.13, No.3,2019
[9] Mohieddine Benammar, Abderrazak Abdaoui, Sabbir H.M. Ahmad, Farid Touati and Abdullah Kadri, "A Modular IoT Platform for Real-Time Indoor Air Quality Monitoring", MDPI Open Access Journal: Sensors, 18(2), 581, 2018


Comments
Post a Comment